NYPD Use of Force Reports Analysis – New Interactive Study
Following a string of high profile force-related incidents – including the tragic death of Eric Garner via police chokehold – the NYPD enacted new guidelines in 2016. These outline when officers should use force and demand that precincts track those incidents. For the first time in modern history, officers are required to detail every instance in which force is used.
New Use of Force Data was Published by the NYPD
The NYPD recently (and unceremoniously) posted the first three quarters of Use of Force data – for the fourth quarter in 2016 and first and second quarters in 2017.
During this period, NYPD officers reported 5,221 use of force incidents. Of these incidents, 66 percent (3,462) were reported by officers in one of the city’s 77 Patrol Services precincts. The other 34 percent (1,759) came from specialized units and bureaus (Transit, Housing, Detective, etc.).
While this is a much-needed step forward for the NYPD, some critics have called the measure “toothless” in that, among other things, its reports don’t track which officer uses force or the race of whom force is applied to. Another issue may be the simple fact that the guidelines rely on self-reporting force incidents.
What does this Police Force Data Mean for Us?
What exactly can data from these reports tell us? Are some precincts using force too often? Can we trust self-reported incidents to be accurate or transparent? Or is it just a half measure towards transparency?
With the help of data visualization firm 1Point21 Interactive, we combined the Use of Force reporting numbers with precinct level data to find out.
Hover over or click the map to see the data for each precinct. Darker color indicates a higher number of use of force incidents.
*Note: Precinct 22 (Central Park Precinct) has been excluded from our analysis because it lacks any population data.
While the 76 precincts reported a total of 3,461 force incidents (we excluded Precinct 22 from our analysis), only 18 of them reported more than 50 incidents over the nine-month period. Perhaps incredibly, 25 precincts reported less than 30 – with 10 reporting less than 20.
Given the population of and the amount of crime in NYC, these numbers seem low – but are they?
Of course, part of the new guidelines encourages police officers to de-escalate situations rather than immediately resorting to force, but it seems unlikely that the department could make a sweeping change in the way it polices that quickly.
How Much is “Enough” Force? Too Much?
It’s difficult to say exactly how many force incidents each precinct should be reporting. The population, demographics and amount of crime vary wildly in each jurisdiction.
Thus, we compared the reported use of force incidents against the population of each precinct’s jurisdiction, the amount of crime reported, and the number of citizen complaints involving force.
We also found benchmarks from several different studies to help illustrate precincts that may not be fully transparent with their reporting or are perhaps using force too often.
Use of Force Incident Rates
(Select one of the chart options below)
By Population | By Crime | By Citizen Complaints
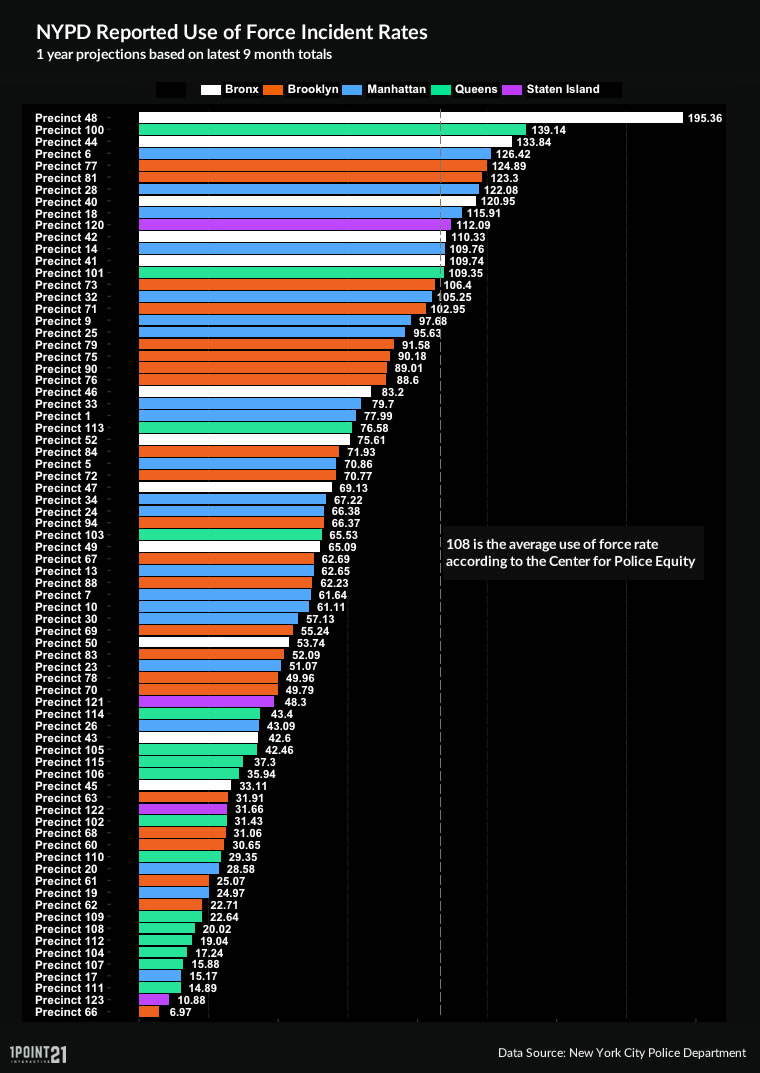
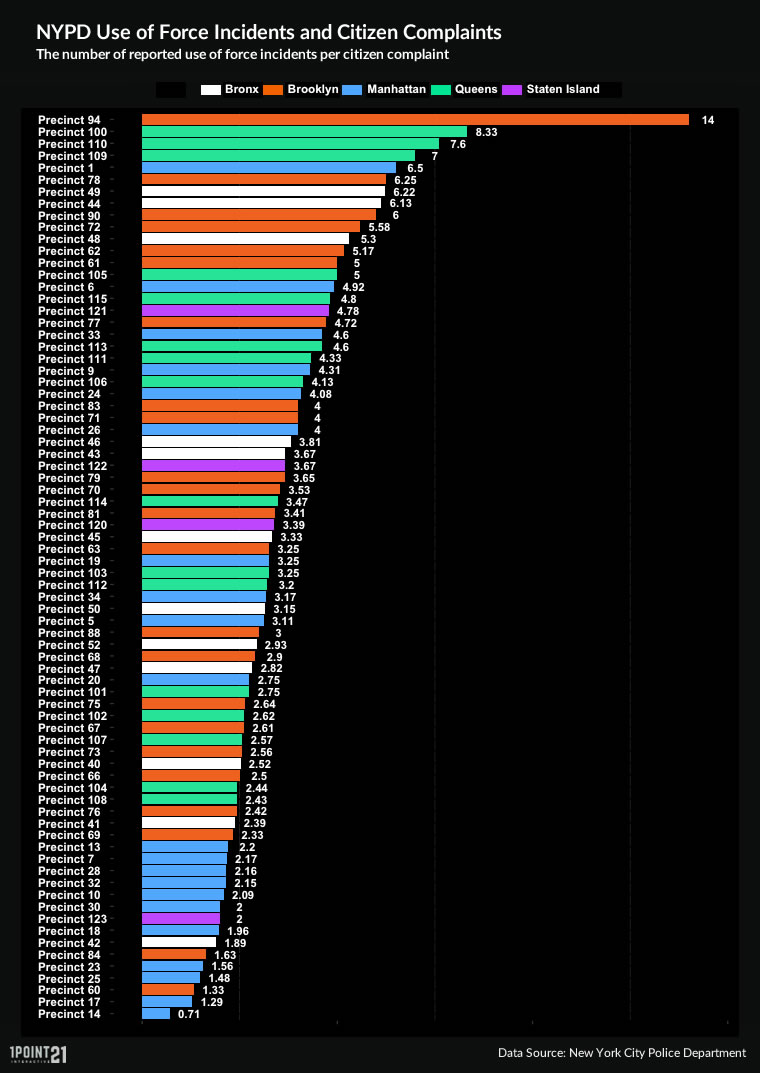
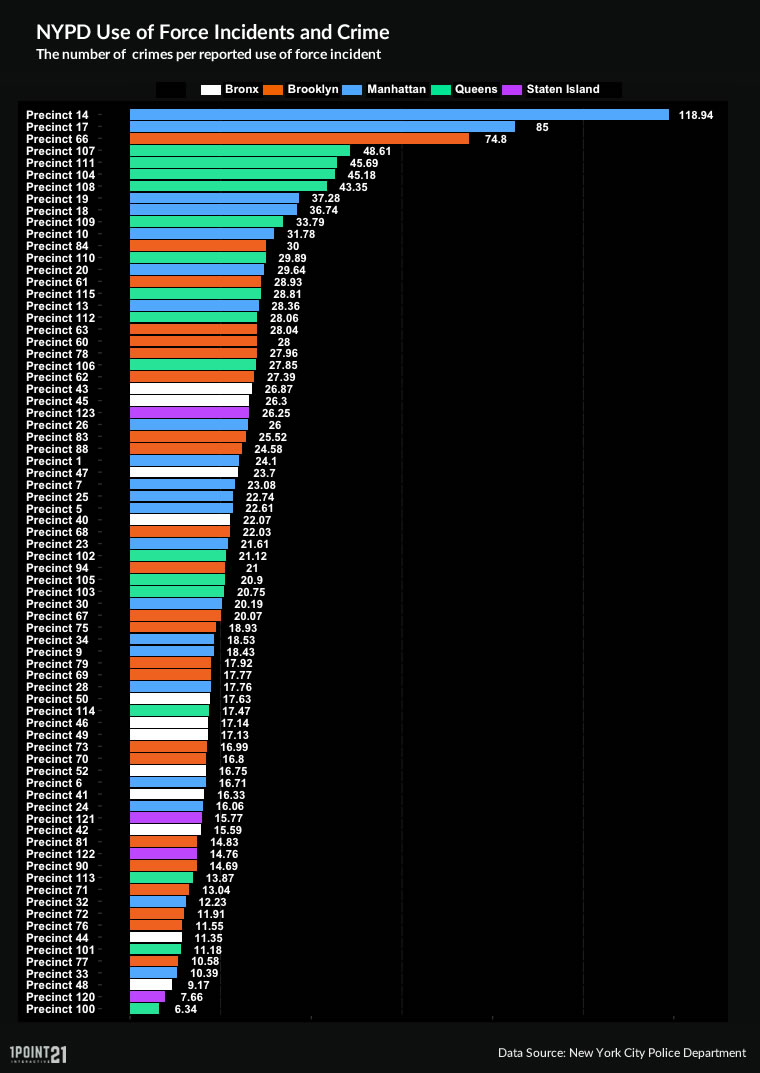
Chart #1: Force Use by Population
108 incidents per 100,000 population.
According to a Center for Policing Equity study, that is how often police use force in the general population across the country. (The same study found much higher rates against Black residents and lower rates against White residents, but we will save those numbers for a different time.)
Using this number as a benchmark, how do NYPD precincts stack up?
After adjusting for population and projecting these data to a full year, only nine precincts were within 10 incidents per 100,000 (above or below) of the CPE benchmark. 32 precincts reported force incidents at less than half that rate, highlighted by Precinct 66 in Brooklyn with only 6.97 per 100k.
On the other end of the spectrum, Precinct 48 in the Bronx reported the use of force at a much higher rate, over 195 per 100k.
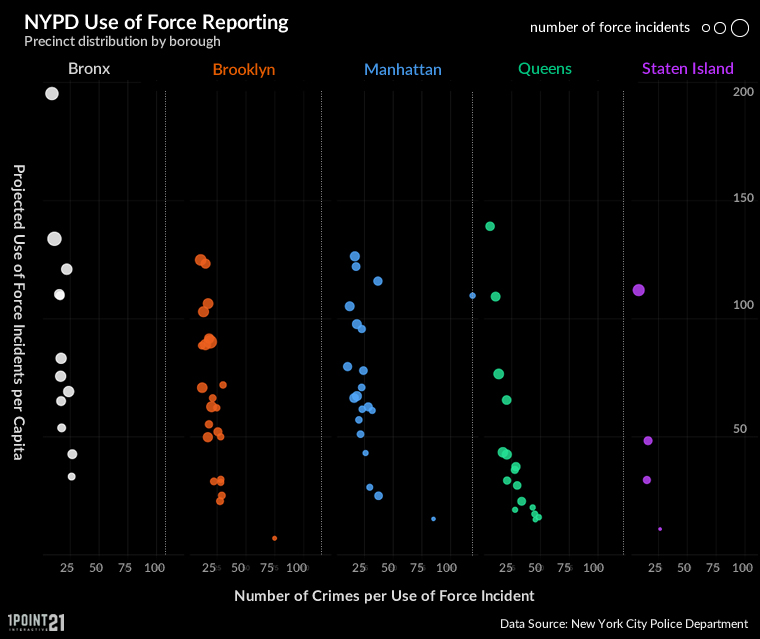
Chart #2: Force Use and Crime
While adjusting for population is important, there are other factors at play. Each precinct deals with varying amounts of crime in its jurisdiction as well. Across limited literature, it is generally accepted that force is used in 15 to 20 percent of arrests. Naturally, force incidents are as much as 20 times more likely during arrests than in non-arrest situations.
While we don’t have arrest data for all precincts, we do have crime totals in each precinct for the same nine-month period. Thus, it stands to reason that precincts dealing with more crime will be making more arrests and be in situations where they may use force more often. However, this doesn’t appear to be the case at all.
Chart #3: Citizen Complaints Including Force
Overall, the rate of complaints to the Citizen Complaint Review Board is much lower than that of self reported use of force incidents. Because of this, nearly every precinct reported more force incidents than complaints they received involving force – save for one. Precinct 14 was the only precinct in our analysis to report less than one incident per complaint, and only eight reported less than two.
What are the Main Takeaways from Our Study?
This program is still in its infancy and NYPD officers are likely still adjusting. However, after looking at the numbers it definitely appears that some precincts are not accurately reporting every force incident, while others appear to be using force too often.
Are there Potential Transparency Issues with these NYPD Precincts?
Precinct 66 in Brooklyn
6.97 force incidents per 100,000. A precinct with a jurisdictional population of nearly 200,000 reported just 10 total force incidents during the three quarter period. While the overall amount of crime was middle of the road for all precincts, there were nearly 75 crimes for every force incident reported – third most of any precinct in NYC.
Precinct 17 in Manhattan
Precinct 17 reported the fourth lowest force use rate per population (15.17) and the second highest ratio of crimes to reported force incidents (85 crimes per reported force incident).
Precinct 14 in Manhattan
Also known as Midtown South, Precinct 14 was the only one in the city with more force related complaints than reported use of force incidents. 14 also had the highest ratio of crimes to force incidents – with nearly 119 crimes for every reported force incident.
(Of note: Precinct 14 initially appears to be right in line with our population benchmark at 109.76. However, its jurisdictional population is by far the lowest. This is likely due to the fact that its jurisdiction contains nearly half the hotels in Manhattan, Times Square, Madison Square Garden, and Grand Central Terminal and Penn Station. Thus, its population is very low, but has the second most reported crime)
Who is Potentially Using Force Too Often?
Precinct 48 in the Bronx
While Precinct 48 didn’t report the most force incidents overall, officers may be using force here far too often based on its jurisdictional population and crime reports. Our 1 year projection had 48 at 195.36 incidents per 100,000 – by far the highest in our analysis and almost 90 more than out benchmark from the CPE. In addition, force was reported as being used once for every 9.17 crimes.
Precinct 44 in the Bronx
This precinct reported the most overall force incidents with 147 in nine months. Due to its larger population, Precinct 44 had ‘only’ had the third highest incident rate per capita.
Precinct 100 in Queens
Precinct 100 reported the second highest rate per capita (139.14) and one force incident for every 6.34 crimes (the worst ratio).
Top image courtesy of: Teresa Shen
Railroad Injuries (FELA Leads)
Request Free Consultation